In the spotlight: Juana Inés de la Cruz

Juana Ines de la Cruz on a 1000 pesos bill

Since I first gained the use of reason my inclination toward learning has been so violent and strong that neither the scoldings of other people … nor my own reflections … have been able to stop me from following this natural impulse that God gave me. He alone must know why; and He knows too that I have begged him to take away the light of my understanding, leaving only enough for me to keep His law, for anything else is excessive in a woman, according to some people. And others say it is even harmful. 

I read this quote in Contact by Carl Sagan. It was written by Juana Inés de la Cruz in her Reply to the Bishop of Puebla in 1691. The Bishop had attacked her scholarly work as being inappropriate for a woman; while he claimed to agree with her views, he didn’t think them appropriate for her sex. Rather than writing, she should devote her life to prayer, an endeavor much more suitable for a woman.

Aargh. 17th century clergymen are just the worst.

We’d better talk about this amazing woman then:

Juana Inés de la Cruz lived in (what was then New Spain but what is now) Mexico in the 17th century and was a self-taught polyglot (my favorite type of inspirational people). She studied scientific thought and philosophy, she was a composer and a poet, all in an age long before women were allowed to do anything involving using their brain. 

If we may believe the stories, Juana started teaching herself at a young age by hiding to read her grandfather’s books. She supposedly learned how to read and write Latin at the age of three. At the age of 16 she had asked her mother’s permission to disguise herself as a man so she could study in some avant la lettre version of She’s the Man; but her mom wouldn’t let her so she had to continue to study in secret. But by then, she already knew Latin, Greek, Nahuatl, and accounting – the most important language of them all *ahem*.

In 1669, she became a Hieronymite nun so she could study in freedom – other monasteries were a lot more strict and wouldn’t allow her to pursue her passion for knowledge, philosophy, and writing. As a nun, she would write on the topics of religion, feminism, and love; often criticizing the hypocrisy of men and defending women’s right to education. In Reply to Sister Philotea, she wrote:

Oh, how much harm would be avoided in our country [if women were able to teach women in order to avoid the danger of male teachers in intimate setting with young female students.]

[Such hazards] would be eliminated if there were older women of learning, as Saint Paul desires, and instructions were passed down from one group to another, as in the case with needlework and other traditional activities.

Okay, now I’m imagining needlework maps of our universe. That’d be cool.

Unfortunately, this story has an unhappy ending. According to some sources, rather than being censored by the church, Sister Juana decided to stop writing and sell all her books, musical instruments, and scientific tools. Other sources claim that her belongings were confiscated by the bishop due to her defiance towards the church. Nevertheless, a lot of her writings have gone lost and soon later, in 1695, after caring for other nuns with the plague. 

There’s a lot of humdrum about inspirational women, in science or not, nowadays. With a lot of books with inspiring stories, such as Rachel Ignotofsky’s Woman in Science, finding empowering role models has never been easier. And I love it. Showing an as diverse possible range of inspirational historical figures provides everyone with role models than can identify with and aspire to. However, I have noticed that my knowledge of inspirational women is primarily European-based. So this is me trying to change that.  

A painting of Juana Ines de la Cruz
“One can perfectly well philosophize while cooking supper.” – Multitasking 101

________________________________________________________

Soucre: ye old trustworthy

A matter of kilos

It’s been the topic of a weighted discussion for quite some time, but today it has been decided: “Le Grand K” will no longer be used to define a kilogram.
“Le Grand K” is not a big box of Special K, but a platinum-iridium cylinder stored by the International Bureau of Weights and Measures in an underground vault in Paris that has defined a kilogram of mass since 1889. There are a few official copies, and many more copies, so each country has their own kilogram to calibrate to.
Last Friday (November 16th) the kilogram has been redefined so it no longer depends on a material object. Because a material object can be scratched, chipped or destroyed. Or stolen. Or accidentally thrown into the bin. And it can degrade – in fact, “Le Grand K” weighs about  50 µg lighter than its six official copies. You don’t really want to gold – ahem, I mean platinum-iridium – standard for weight to change in weight, right?
So now the kilogram will be defined based on a universal, unchangeable constant. Much better, I think you would agree. The constant of choice here is the Plank’s constant, a number that converts the macroscopic wavelength of light to the energy of individual constants of light. Representatives from 58 countries universally agreed on this new definition, so from next year, the kilogram will be constant forever.
The ampere (electrical current), the kelvin (temperature) and the mole (amount of chemical substance) have also been redefined. That means that all seven units in the International System of Units (S.I.) will be defined by universal constants:
meter unit of length
  • Originally defined as a 10-millionth of the distance between the North Pole and the Equator along the meridian through Paris, later as the distance between two scratches on a bar of platinum-iridium metal
  • Since 1983 defined as the distance traveled by a light beam in vacuum in 1/299,792,458th of a second, with 299,792,458 m/s being the universally constant speed of light.
kilogram unit of mass
  • Initially defined in terms of one liter of water, but since as a small ~47 cm3 cylinder stored in a basement in Paris.
  • Now redefined in terms of the Plank constant h = 6.62607015×10⁻³⁴ J*s (J = kg*m2*s−2)
second unit of time
  • Originally defined as 1/86,400th of a day
  • Since 1967 it has been defined as the time it takes an atom of cesium-133 to vibrate 9,192,631,770 times
ampere unit of electrical current
  • Originally defined as a tenth of the electromagnetic current flowing through a 1 cm arc of a circle with a 1 cm radius creating a field of one oersted in the center
  • Now redefined in terms of the fixed numerical value of the elementary charge e (1.6602176634×10⁻¹⁹ C with C = A*s and second defined as above)
kelvin unit of temperature
  • The centigrade scale was originally defined by assigning the freezing and boiling point of water as 0 °C and 100 °C respectively. Note: absolute zero is the lowest temperature (0K =  -273.16 °C)
  • Now redefined in terms of the Boltzmann constant k = 1.380649×10⁻²³ J⋅K−1
mole unit to describe the amount of substance
  • Since 1967 defined as the amount of substance which has as many elementary particles as there are atoms in 0.012 kg of carbon-12.
  • Now one mole substance contains exactly 6.02214076 × 10^23 particles. This constant is known as Avogadro’s number*
candela unit to describe the intensity of light
  • Originally taken as the luminous intensity of a whale blubber candle in the late 19th century.
  • Since 1979 the light intensity of a monochromatic source that emits radiation with a frequency 5.4 x 10¹⁴ hertz and has a radiant intensity of 1/683 watt per steradian in a given direction **
So that was “this week in science.” I’ll leave y’all with a related joke:

kilogram

_____________________________________________

Sources/Further reading:

The international system of units: en.wikipedia.org/wiki/International_System_of_Units
The new kilogram was in the news: www.nytimes.com/2018/11/16/science/kilogram-physics-measurement.html and www.theregister.co.uk/2018/11/17/amp_kelvin_kilogram/
Comic from xkcd.com

_____________________________________________

* Avocado’s number, however, states that 6.02214076 × 10^23 guacas make up one guacamole. (I knooooow, I already made this joke).
** I have to be honest and say that I have no idea what this all means

Rainiest city in the US (?)

Somehow, I always end up moving to the something-est city in a certain country. I’ve lived in the flattest city of France (which is – surprisingly – a city in the Alps: Grenoble*), the sunniest city in Scotland, and I’m sure I can find something mostest about all the places I’ve lived.

That’s probably because cities like bragging about being the best at something. On the other hand, it’s not really bragging when you call yourself the “rainiest city” in the U.S., as Seattle is known to be, so perhaps I now really do live in the rainiest city in the U.S.

First, people have been a little shocked when I told them I’d been moving to Seattle. Why would you do that? they’d say, it’s always raining there! But after I tell them about living in other rainy countries, such as Scotland, they’re like Oh, you’ll be fine.

I’m not the wicked witch of the West, you know, I won’t melt.

But anyway, the question is, is Seattle really the rainiest city in the U.S.?
The pictures on my phone tell a mixed story:

IMG_20181020_174309987
Union Lake Park, beginning sunset, no cloud in the sky…

IMG_20181021_122624955
Union Lake, on a cloudy day

IMG_20181103_130600092
A rooftop view on Seattle and a lot of clouds (spot the needle in the haystack clouds)

Obviously, I don’t take my phone out for pictures when it’s pouring… and three-ish weeks does not constitute a large enough sample size of days to judge on overall raininess, not to mention that it is entirely perception based.

To the internet it is then… That quickly took me to a 2013 blog post that confirmed my suspicions: Seattle is not the rainiest city in the US. Data taken from over three decades from Weather Service stations in major U.S. cities tell us that Mobile, Alabama is the rainiest city with 66 inches** of rain a year. Seattle averages around 37 inches, which is less than the U.S. average (39 inches). It turns out, that the southeast gets considerably more rain than the North-West.

Of course, inches of rain does not give us the whole picture. Olympia, Washington, is the city with the most rainy days annually (111 days). At least some city in Washington gets to have a record, even if it isn’t Seattle. By the way, Seattle has less rainy days than the U.S. average (92 vs. 102).
While we’re at it, let’s look at a quick overview (with UK and Belgium added for comparison):

Seattle Olympia Mobile U.S. average U.K. Belgium
Rainfall (in) 37 48 66 39 34 32
Rainy days 92 111 79 102 107 212***
Sunny days 152 136 220 205
Hours of sunshine**** 2170 1493 1546

Looking within the U.S., Seattle has a bit less rain than average and fewer rainy days. However, there are also fewer sunny days in Seattle. Maybe the reputation of Seattle being rainy comes from it feeling like it’s always murky and gray. Furthermore, “rain” in Seattle tends to be a light drizzle (which does not add up to rainfall in inches and perhaps isn’t always counted as a “rainy day”). Though, as places in Washington State go, Olympia seems to be even drearier.

If we compare Seattle to the U.K. and Belgium, Seattle has a bit more rainfall, but fewer rainy days and more hours of sunshine. I think I’ll be fine here … definitely given the fact that there are actually seasons, hurray!

__________________________________________

* Fact check, I am not 100% sure Grenoble is the flattest city in France, but their tourist website says it is. From my experience living there, it is very bikable as long as you stay in the city, but once you’re out, it’s all uphill from there …
** All the data is in inches. I know that’s annoying but transferring everything to cm is tedious and doesn’t really add much because everything is relative. But in case you were wondering, 66 inches ~ 1676 mm.
*** data obtained over a 10-year period, as opposed to over a > 30-year period for the other data shown.
**** Number of sunny days not always found, so I added a row with hours of sun.

Numerical values obtained from https://www.bestplaces.net/compare-cities/, or more specifically by comparing Seattle to Olympia, or by googling “How many days of ___ in ___?” 

A close-knit bit of history

About a year ago, I took up knitting. I started simple and obvious by knitting a scarf.

Picture of a pink knitted scarf
I made dis.

I then went on to knit a headband, a pair of arm warmers, and another headband. Currently, I am knitting a sweater. I guess you could say that I’m getting into the more advanced stuff – nevermind that it is the simplest sweater pattern ever*.

What I haven’t even dared think about knitting, is socks. Even though socks have been knitted for ages. And I really do mean ages. It may come to no surprise that the ancient Egyptians were a lot more talented than I am and that they were able to knit stripy socks. Exhibit A**: the 1700-year-old- stripy sock that recently made the news.
To be completely truthful, the sock was more likely a product of nailbinding, the precursor of knitting (also sometimes referred to as “knotless knitting”). The oldest evidence of true Egyptian knitting dates from between 1000 and 1400 A.D, so still pretty old.
By the way, Egyptian socks were pretty weird in the sense that they had a separate compartment for their big toe so they could wear sandals and flipflops.

toe socks
Remember the #Naughties when toe socks were okay? (I definitely had a pair of these monstrosities)

Back to the 300 A.D. stripy sock:

Recently, scientists at the British Museum have refined a multispectrum imaging technique to study the chemical signatures that can be found in the threads. Importantly, this imaging technique is non-invasive, in contrast to other common techniques: no physical sample needs to be taken. Just by taking images using different types of light, information about the dyes that were used can be extracted.
Surprisingly, the number of dyes that were available to the knitter (m/f, who knows?) were limited; there were four dyes in the sock, probably derived from plants: madder (red), woad (blue), weld (yellow) and tannin (brownish). But people were creative, and remembered their kindergarten art lesson: to create more colors, you mix your base colors! The ancient Egyptians would use double and sequential dying, or twist fibers together, to expand the available hues and create the many stripes.

Untitled.png
An Egyptian child’s stripy sock in different lights, from the original article.

We know this because the researchers combined different types of light and imaging. Typically, when you take a picture with a standard camera, you are capturing the reflected visible light – as was done in panel (a) in the image. This gives you information about the colors that we can see with our eyes, i.e. “visible”, with wavelengths between ~ 400 and 700 nm. ***
By using light of different wavelengths, they learned more about the chemical properties of the sample. For example, by illuminating and capturing infrared light – with wavelengths over 700 nm (c, false-colored in d) – or ultraviolet (UV) light – with wavelengths under 400 nm (e, false-colored in f).
There’s one panel I left out… Materials do more than just reflect light, they also absorb light: transferring light energy into another type of energy. This energy can be heat, but it can also be re-emitted as light of a different wavelength than the incident light, a process called luminescence. An example of luminescence is the glow-in-the-dark (phosphorescent) stars I have on my ceiling. Another example, and more relevant to the sock, is taking a picture of the visible light while using UV-lighting, or UV-induced visible luminescence (b).
So each dye has in a unique “fingerprint,” a unique combination of signatures using these different types of light. Well, relatively unique – it’s science, everything is “known” with a certain statistical significance. In any case, this allows the British Museum scientists to make very educated guesses about what dyes were used, in which combinations, and in which amounts.
My sweater-to-be is going to be stripy too. Luckily for me, I can just go to a yarn shop and by a huge ball of wool (light blue) and some silver thread to add in for the lines. I don’t need to do any dying. And who knows, perhaps scientists 1700 years in the future will have some newer imaging technique and want to study my sweater?

Screen Shot 2018-11-01 at 18.27.35.png
Bonus PDMS-lens picture of my sweater-to-be. Visible light, in case you were wondering.

______________________________________________________

* basically 4 rectangles: two rectangles for the front and the back, two rectangles for the sleeves.
** There will be no Exhibit B.
*** Heyoooo, this history-post just got some physics knit into it!

______________________________________________________

Addition on October 25, 2019: I’m still working on this sweater…

Oh, when the ants come marching in

(No, that’s not a typo, I did not forget the “s” and the “i,” this post will be about ants)

Occasionally I go swimming. The problem is that I always lose count of how many laps I’ve done. It takes slightly too long to just remember what number the previous lap is – because my mind starts wandering. So I came up with a strategy: singing counting songs. Like “the ants go marching.”
You know:

The ants go marching one by one, hurrah, hurrah
The ants go marching one by one,
The last one stops to have some fun*
And they all go marching down to the ground
To get out of the rain…

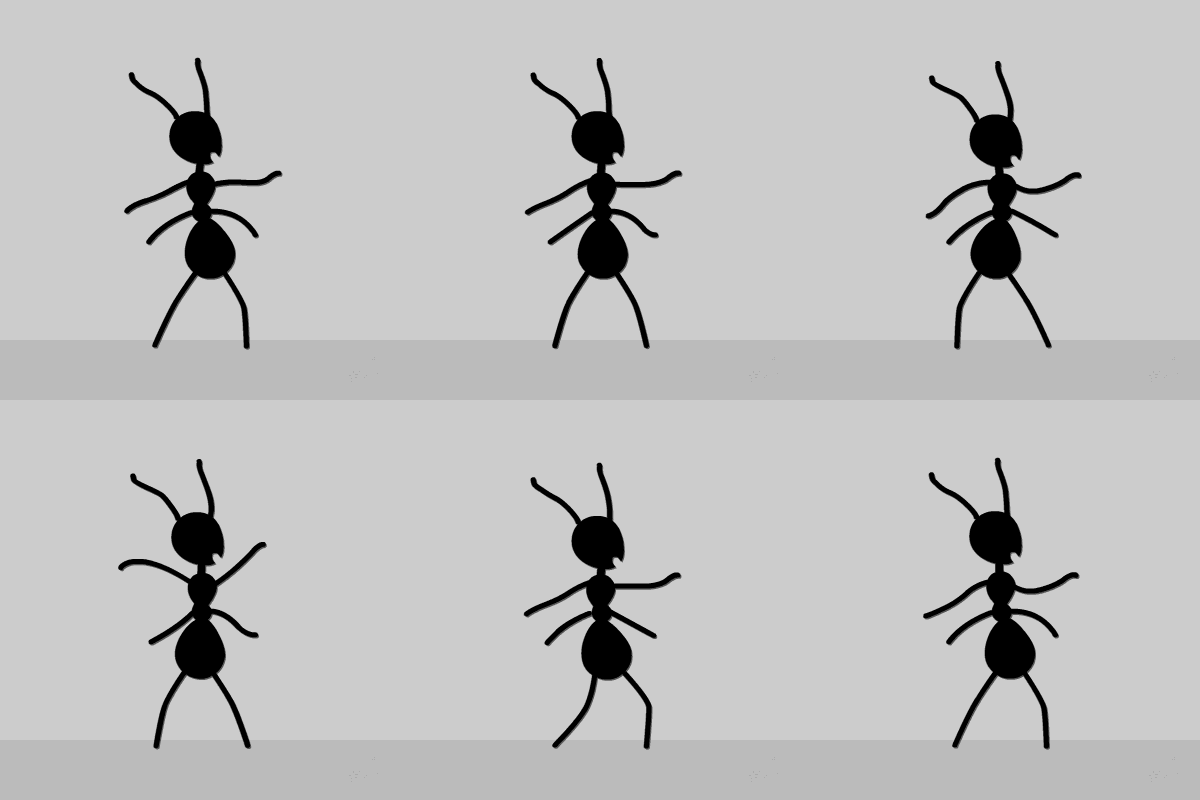
gif of an ant dancing
This ant just stopped to have some fun.

One verse takes me about the same time to swim a lap, so it’s perfect. And because of the combination of the number and the rhyme, I don’t really forget what number I was on.
The song goes on with increasing numbers:

The ants go marching two by two, hurrah, hurrah
The last one stops to go to the loo…

The ants go marching three by three, hurrah, hurrah
The last one stops to have a wee…

The ants go marching four by four, hurrah, hurrah
The last one stops to slam the door…

etc.

However, a few weeks ago when I was happily swimming and internally singing, my mind started wandering anyway. I was wondering about the math of the song. How many ants would we need to have to make it work? And apparently, thinking about math and swimming also makes me lose count of laps.

Obviously, I did not find the answer during my swim session. But I have now. Here is the problem:

  • There is a row of ants marching down to the ground. Initially, the ants are marching in single file, then double, then three by three etc. until – let’s say – ten by ten.
  • There is always a random lonely single ant at the end of the parade who gets distracted by something, stops, and basically gets lost to the colony.
  • I want to figure out how many ants do you start with to make this song work.

The answer lies in the lowest common multiple (LCM). That’s a name given to the lowest number that is the multiple of two or more numbers. For example, the LCM of 4 and 6 is 12. Add 7 to the list and the LCM is 84. In other words, it is the lowest number you can find that can be divided by all your given numbers.

In the case of ants marching, at the end of the song, we’ll have lost as many ants as verses we’ve song. So if we sing it 10 times, there will have been 10 ants stopping to do some random action (that poor ant in verse seven though, she went to heaven), which is a lucky break because we are already looking for a number that needs to be divisible by 10 (and that number minus 10, can still be divided by 1). In other words: the answer to this conundrum lies in finding the LCM of all the numbers 1 through 10.**

Even more luck for me: there are several websites that calculate this for you (though there are some tricks to help you solve it). It turns out that the LCM of numbers 1 through 10 is 2520. In other words: there need to be 2520 ants in our initial parade to make my version of the song work. (If anyone feels the sudden urge to write a simulation to illustrates this song, please let me know; I know it could look cool.)

In case you are curious, going up to 11 requires 27720 ants, same for 12 verses, and for 20 verses we’d need to start out with a whopping 232792560 ants. The rule is that to end up with ants marching by n, you need the LCM(1,….,n).

However, considering that in the case of black garden ants, the average colony size is 4000-7000, marching up to 10 by 10 is pretty much the limit.
The most practical application of LCMs has nothing to do with ants, which are usually considered a pest even though all they really want is to clean up that crummy mess you left. No, the application has to do with solving fractions or word problems involving fractions. For example, if you share a cake with some friends, say I eat a quarter, my friend V isn’t very hungry so she eats a sixth, and my other friend S didn’t finish his dinner so is super hungry and he eats a third, you could use the LCM to figure out the denominator and calculate how much of the cake is left:

We ate 1/4 + 1/6 + 1/3
Using the LCM of 4, 6 and 3 this is 3/12 + 2/12 + 4/12
In other words, we ate: 9/12 or 3/4
So there is still 1/4 cake left.

Not for long though, I’ll probably eat it later.

Arfcher meme: Do you want ants? Because that's how you get ants.
Clean up after yourself when eating cake.

_________________________________________

* I know I have the lyrics wrong here and it’s the little one that stops to tie its shoe but that doesn’t help with the math that I will get into later. Also, lyrics vary: while I sing have some fun, the internet tells me it’s “sucks his thumb”. Later on in the song, I definitely get more creative with the rhymes. Well, I say that got creative, but it was more likely a joint effort of a nation of six-year-olds.

** I really need to thank my friends (V&S) because I utterly confused myself by trying to find a “rule” and they basically solved my problem for me. #NerdFriends

What is this “science” thing?

I’ve felt bad all week. Well, not really all week. And not really bad. I’ve felt a teeny bit guilty for joking that economic sciences is not really a “science”. The “soft” sciences (social sciences, economic sciences, psychology, to name a few) are too often ridiculed by practitioners of the “harder” sciences. I’ve done it too. Last week in fact, as I’ve just said.

purity
If the sciences were ranked (by xkcd)

Most of the “soft” scientists I know don’t really mind too much (yes, I have soft science friends, I *can’t* be an elitist), and they laugh along. But still, I wanted to bring a bit of nuance and perhaps a tiny apology,

(sorry)

especially since this years’ Nobel Prize for Economic Science was awarded for integrating climate change an technological innovations into long-run macroeconomic analysis. Two subjects that are kind-of STEM-related.
Therefore, no matter how you might be willing to rank them, something can be considered science (from the Latin word scientia – “knowledge”) if the scientific method is applied.

What’s this scientific method?

The scientific method is a way to approach a problem or question by following this – or any similar – flowchart:

The Scientific Method: Obervation, Question, Hypothesis, Experiment, Analysis, Conclusion
Example of a scientific method flowchart

Very briefly and with an example, these are the steps you’d follow:

  1. Observation
    This can be anything you observe.
    Example: People seem a lot friendlier here in [town A]. When I pass people on the street, people smile at me more than they did when I was in [town B].*
  2. Question
    From that observation, you can formulate a well-defined question, a problem you would like to know the answer to. Science is simply the pursuit of knowledge, you know.
    Example: Are people more friendly in [town A] than in [town B]? (if friendly is defined as “smiling at people on the street”)
  3. Hypothesis
    You probably have a little bit of data (from your observations) that allow you to formulate the answer you would expect. This possible answer is something you can test: is what you assumed true or false?
    Example: People in [town A] smile more on to passers-by than in [town B]
  4. Experiment
    Now it is time to collect your data.
    Example: I’d go to [town A], walk around in the center for – say – 30 minutes and count how many people I pass on the street (and actually make eye contact with) and how many people smiled at me. I’d then do the same for [town B].
  5. Analysis
    When you have collected all your data, sit down and perform some analysis. Usually, statistics are the thing to apply.
    Example: I’d calculate the ratio of smiling people in each town, let’s say 17 out of 59 (29%) of people smiled at me in [town A], while 34 out of 81 (42%) people smiled in [town B].
  6. Conclusion
    Example: I reject my hypothesis; people in [town A] are not friendlier than people in [town B].
    This last step is checking if my hypothesis was correct (it wasn’t). Rejecting the hypothesis means I can go back and change my hypothesis and start again. If my hypothesis was correct, yay – I’ve done science!

Well, in reality, there is even more to it (both for rejecting and accepting an hypothesis).
In this example, there are many faults. Was my definition of “friendliness” correct? Were there factors I didn’t account for, like a bit of spinach between my teeth that caused more people to smile (or laugh) at me? More importantly, if I repeat the experiment, do I get the same result**? Was my experiment well designed; maybe there are better ways to test this same hypothesis?

Back and forth and back and forth and back and forth again.

Science is a very iterative process. Hypotheses are constantly being reformulated and retested. It is actually impossible to be 100% a hypothesis is true. The real science is when you try every which way to disprove your hypothesis. It is after a lot of back and forth and iteration, that a theory about something can be formulated. But you should know that in the scientific lingo, a theory has nothing to do with guesswork. It is the result of several repeats of observations and experiments that are generally accepted as reliable accounts of the world around us. ***

Scientist vs. engineer

I’d also like to note that science and engineering are quite different things. A scientist wants to know how things work while an engineer kind of just wants to make things work.
For example: engineers built the large hadron collider; scientists use it to study elementary particles.
Though it should be said that a lot of scientists have a bit of engineering in them, and vice versa, so this is probably a giant simpification.

___________________________________

* I just know that this is just because I look funny.
** Typically, at least three repeats showing the same conclusion are necessary to accept a hypothesis.
*** More about scientific theory here: https://www.gotscience.org/2015/10/theory-vs-hypothesis-vs-law-explained/

A Nobel Cause

So, the news is out. At least in terms of the sciency Nobel Prizes (sorry Economic Sciences, you don’t really count here), the 2018 Laureates have all been announced, so here’s a short overview of what was Nobel-Prize-Worthy this year:
1. Nobel Prize in Chemistry (press release)
And… *drumroll* the Nobel prize in Chemistry goes to Prof. Frances H. Arnold, Prof. George Smith and Sir Gregory Winter for their contributions to protein biology, where they all worked on directed evolution of proteins.
Directing protein evolution is used to create proteins with a specific function that can be used in biofuel, pharmaceutical, and medicine manufacturing. Half of the Nobel Prize was awarded to Prof. Arnold, who works on directed evolution of enzymes (proteins that are used to accelerate or direct chemical reactions). The other half, that of Prof. Smith and Sir Winter, celebrated a method called phage display. This process uses viruses to develop specific proteins that can be used for medical purposes.
My personal excitement for this prize:
Well, Prof. Arnold is a professor in bioengineering, which is, in my opinion, an underacknowledged field, so that’s pretty cool. And this has nothing to do with the fact that I’ve studied bioengineering. Nothing at all.


2. The Nobel Prize in Physiology or Medicine (press release)
The Nobel prize in Physiology or Medicine was awarded to Jim Allison and Tasuku Honjo for their work in cancer therapy. By now, the concept of “immune therapy” may not sound extremely new anymore. However, just think about how amazing it is: someone’s immune system (in other words, an attack system that is already present in your body) can be used to fight cancer cells (which isn’t really straightforward – cancer cells originate from normal cells so are not detected as “foreign” by the immune system).
My personal interest in this prize: 
First of all, yay for biology completely highjacking the Nobel Prizes. But on the topic: radiotherapy and chemotherapy are both notorious to have a huge amount of side effect. By effectively using the natural defense system of the body, immune therapy usually is a lot less taxing on a patient, which I think is a laudable goal.
https://twitter.com/NobelPrize/status/1046694080883949568


3. The Nobel Prize in Physics (press release)

*Final Drum Roll, please*
The Nobel Prize in Physics is all about lasers (Did you know that LASER is an acronym for “Light Amplification by Stimulated Emission of Radiation? Well, you do know). Arthur Ashkin was honors for his development of optical tweezers (which I will simply explain by referring you to my fabulous friend who has worked with optical tweezers herself) and the other half was awarded to Donna Strickland and Gerard Mourou for their work on laser pulses. The most known application of laser pulses is in laser eye surgery.
My personal input to this prize:
I have two thoughts, first, how has this not won a Nobel Prize yet? Actually, to be honest, I think that quite often when the Nobel Prizes, which is probably why they get a Nobel Prize in the first place. The other thought has to do with the same reason why this prize has been in the press a lot: it has been 55 years since a woman won a physics Nobel prize. Only two other women have a Nobel Prize in Physics to their name: Marie Skłodowska-Curie (obviously!) and Maria Goeppert-Mayer (go google her, now).
https://twitter.com/NobelPrize/status/1047061973966512130
Some thoughts on women and Nobel Prizes
Historically, science has always been pretty male-dominated. And even now, women are underrepresented in research: worldwide the female share of persons employed in R&D is approximately 30% and I will not even get into high-level academics here.
In terms of Nobel Prizes, as of this year, there have been 49 women who have won Nobel Prizes (that’s all of them), compared to 844 men. In the sciency fields, five women have won the Nobel Prize in Chemistry (2.8%), twelve have won the Nobel Prize in Physiology or Medicine (5.6%), and – as stated – three have won the Nobel Prize in Physics (1.4%). Actually, only one woman has won the Nobel Memorial Prize in Economic Sciences (also 1.4%), but that doesn’t really count as a science anyway!
In any case, none of the Nobel Prizes have a good track record, and it makes me a bit sad that “First woman Physics Nobel winner in 55 years” is a news headline, but ah well, we may have come some part of the way but we are not there yet.
And until we are, having positive role models of all shapes and sizes and sexes for STEM fields is crucial. As a wannabe science-communicator, or science-populizer if you will, one of my aims is exactly that. So that every child can look up to a scientist and think “that could be me!”
And – even if I say so myself – I think that’s a pretty noble cause.

___________________________________________________

Bubbles!

Let’s talk bubbles…

Gif of a yellow fish in a fish tank getting all excited about bubbles
Calm down there, buddy.

Over the summer, I have tapped quite a few beers. Some of those beers were Guinness. The first few times I went through the Guinness-tapping-process (who am I kidding, all the times), I would marvel at the fact that the bubbles were going down.

So, Guinness is an easy but slightly time-consuming beer to tap. First, you need to fill the glass about 4/5ths and let the bubbles settle. When you get that nice black/white beer/foam divide, you top it off by pushing on the tap (which is a slower flow). So that all takes a while. But that means you can stare at these sinking bubbles for quite some time.

giphy-5.gif
Guinness bubbles going down down down.

But wait. Bubbles aren’t supposed to sink? Aren’t bubbles gaseous and therefore lighter than liquid? Hence, shouldn’t they rise as bubbles do in normal bubbly beverages? What’s going on?

From a uni class some time ago, I remembered that Guinness bubbles sink, so at least I wasn’t hallucinating. But why I forgot why exactly. (Com’on, the class was years ago and who remembers anything anyway. There’s the internet for that.)

Of course, there is science about this. I mean. Scientists are basically fueled by coffee and beer. And Guinness is sort of both.

It seems that there are a few factors that contribute to the sinking bubbles: the type of bubbles, the size of the bubbles, and the shape of a Guinness glass.

First of all, not all bubbles in Guinness sink, just the ones you can see. When the beer starts to settle, larger bubbles start to rise (as bubbles do). Because of the shape of the glass, you can’t really see this happening: the bubbles originate in the bottom of the glass, which is narrower than the top, and they form a central column of rising bubbles. This causes an upward liquid movement. As a result (because the liquid doesn’t magiacally fountain out of the glass), a downwards liquid flow occurs along the walls of the glass. If all the Guinness bubbles were large (> 50 µm), as is the case with bubbles in lighter beers, the buyancy would counteract the liquid flow (they’d be superlight and not care about what the liquid is doing) and rise. However, Guinness has teeny tiny bubbles (< 50 µm) that just get dragged along with the flow. And therefore, along the walls of the glass, they appear to be sinking.

Flow pathlines in a glass of Guinness. Image c/o Fluent Inc.
Psychadellic flow lines in a Guinness glass. (Image © Fluent Inc.)

So the second factor is the small bubbles. Guinness taps have fine holes that cause these small bubbles to form*. Moreover, Guinness bubbles are nitrogen and not carbon dioxide, which is more easily dissolvable in liquid. Most bubbly beverages, including lager beers and soft drinks, contain carbon dioxide to create the fizz. In these cases, gas bubbles appear from tiny defects in the glass surface and continue to grow as more carbon dioxide undissolves**. But nitrogen gas doesn’t dissolve in liquid as well as carbon dioxide, so the bubbles that do appear don’t grow in size. In other words, bubbles stay small enough to be dragged along with the downward liquid flow.

Finally, add the fact that Guinness is very dark, causing a high contrast with the light coloured bubbles, and you see these nice sinking bubbles.

Now, if you are in a place where the drinking time is acceptable (pm), go get yourself a Guinness. Otherwise, just stick to coffee.

ezgif.com-reverse.gif
Reverse yellow bubble fish looks even more insane.

_________________________________________

* In a can of Guinness can there is a small ball that, as far as I can tell, serves the same purpose. Edit: it’s confirmed that this small ball – also called a “widget” (thanks to my uncle Tim for this factoid) – indeed causes the slow release of nitrogen after the can is open.

** What, that’s not a word? What’s the opposite of dissolving then? *googles* Condensing? That doesn’t sound right?

Sources: Bubbles the fish is from Pixar and most of the info is from: https://plus.maths.org/content/probing-pint

And of course, there is more beer physics if that’s your thing (read it while drinking some beer responsibly): https://www.npr.org/sections/thesalt/2013/11/20/246390302/beer-tapping-physics-why-a-hit-to-a-bottle-makes-a-foam-volcano?t=1537774279547

Baking vs cell biology

Recently, I have learned that baking sourdough bread is very similar to maintaining cell culture. Lately, the conversations I’ve been having with my dad remind me very much of the conversations I used to have when I was still actively maintaining a cell line in the lab.

This inspired me to take out my drawing notebook and fail at sketching this concept:
IMG_20180913_095325 (1).jpg
If you would like to start up your own sourdough bread culture, basically, you just take some flour (50 g, apparently rye works pretty well) and add the same amount of water and leave this on your kitchen counter. For a week or so, mix in a tablespoon of flour and a tablespoon of water. Over time, this mixture will become alive with a culture of bacteria (the good kind) and yeast (the good kind) that you can then use to bake bread.

Basically, if you take out some of this starter mixture for your bread, and supplement whatever you took out with new flour+water, you can keep this “culture” going in the fridge and bake bread until infinity. (For details, the internet has lots of examples of how to start up your own sourdough and subsequent bread recipes, for example, this one.)

A little bit like culturing cells in the incubator until infinity.

And if you mess up (like accidentally use all your starter), you can either start over or take some out of the freezer (if you’ve frozen some down at some point, obviously). For cells, you’d take some out of the -80C.
So you see, similarities are endless!

Whatever you do, don’t talk about your cells/yeast like it’s a pet. It weirds people out (trust me).

_____________________________

Notes:
* The calculation bit is about things that are actually pretty simple but somehow are complicated to explain.Also, I should note that my dad isn’t really that bald, I just can’t draw hair (sorry!). Also, you’re supposed to tie up your hair when working with cell culture.
This is why I usually don’t draw stuff, people.

I was at the Friggin’ Fringe

Almost three years ago, I mentioned – in a passing comment – the Edinburgh Fringe (“a ridiculously elaborate comedy festival that is held in Edinburgh every August, for almost a whole month”). Specifically, I talked about how much “Nerd Comedy” there was at the Fringe. This year was no different.
Well, I guess the difference was that, instead of going to the Fringe for a day or two, I was at the Fringe for a whole week. In fact, I was part of a show.

I still can barely believe it.

And of course, I was in a nerdy show.

Anyway, it was absolutely amazing. We had a total of 162 people come to our show over the course of 5 days, which was an absolute amazing turnout. We got a lot of laughs. We sometimes lost our track (or the chords) but that was just part of the charm. We made a lot of silly faces. Well, I did.

FacesFringe
Some of Valerie’s many faces (I actually look worried a lot of the time)

For me, it was mostly a lot of adrenaline. I know this barely constitutes as a proper blog post about doing a Fringe show, but I just wanted to have mentioned it. While I’m at it, let me thank Matt, Coren, and Yana for being such amazing co-stars; Valentina for the amazing organization; and MCAA for putting me on a stage.

There will be a video for those that unfortunately had to miss it, at some point in the pretty near future. So if you were like *damn, can’t believe I missed that,* there’s no need to worry!

____________________________________

Note: wow, that is a lot of pictures of me, it’s quite unsetteling. I’m so sorry.